Track the performance of your SD-WAN network through Grafana Labs intuitive dashboards, facilitating analysis and rapid response.
Did you know that you can now easily integrate Grafana directly into your SD-WAN for MikroTik?
Our custom dashboard is available in the MikroTik SD-WAN platform marketplace and is designed to take your monitoring to another level.
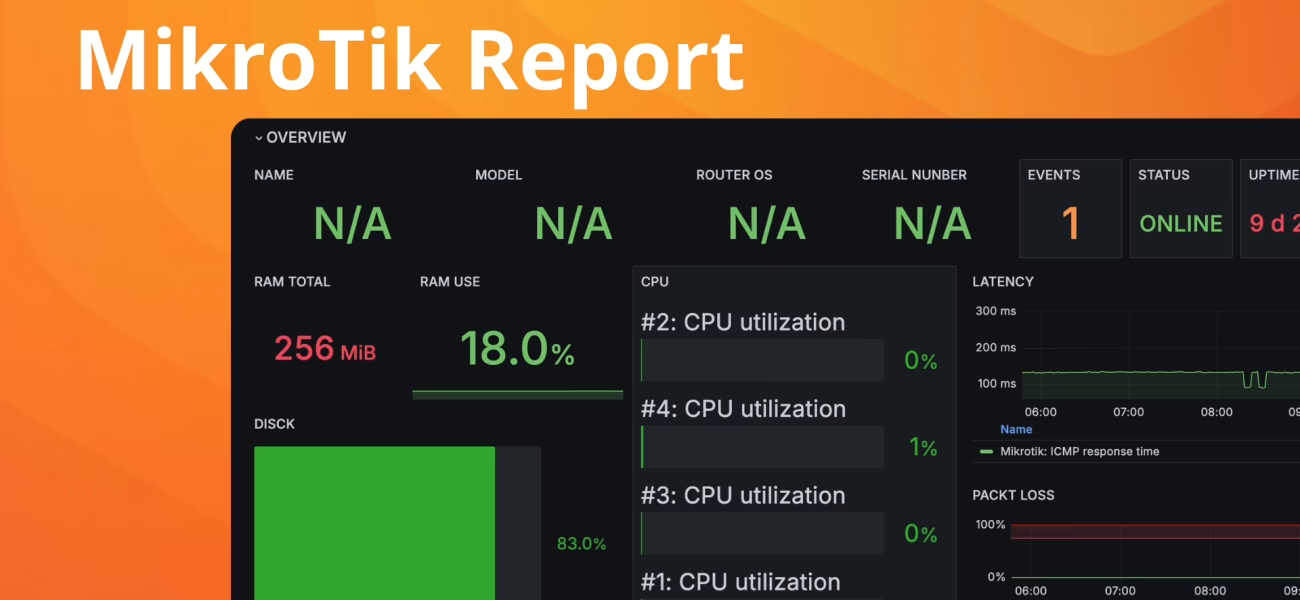
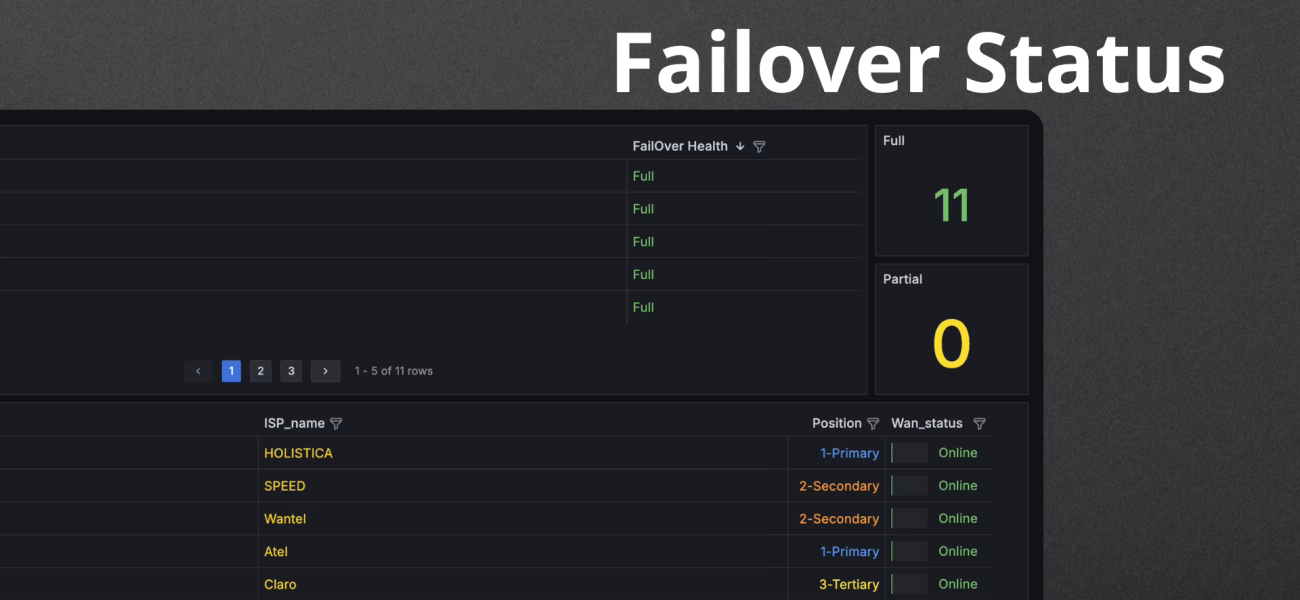
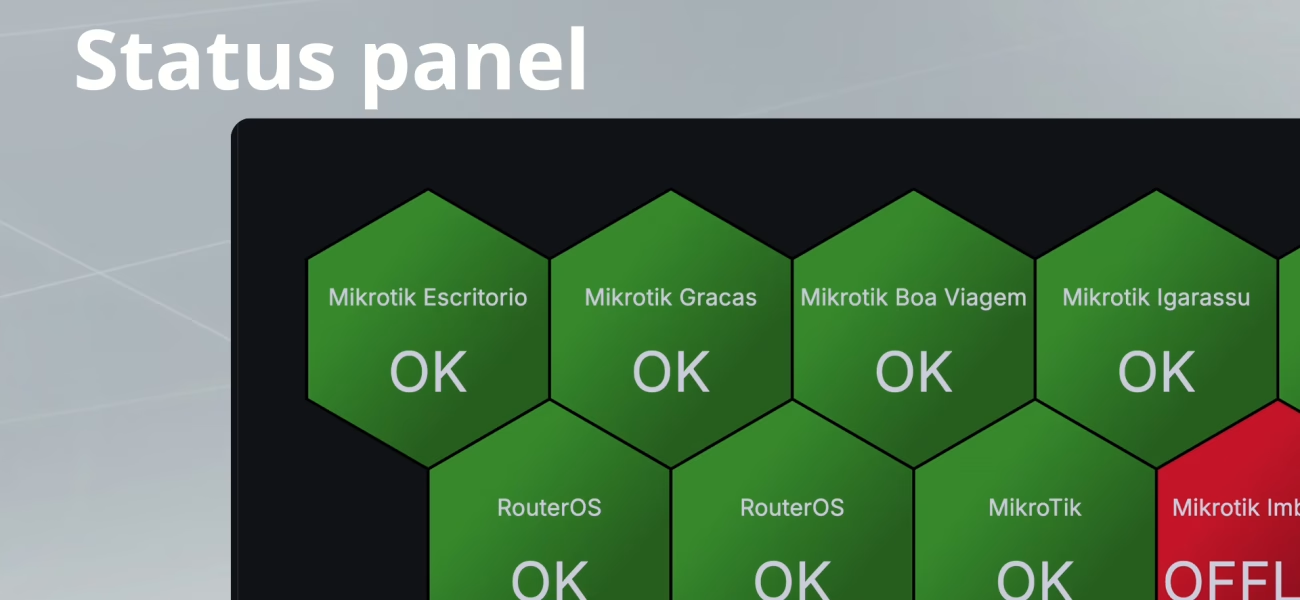
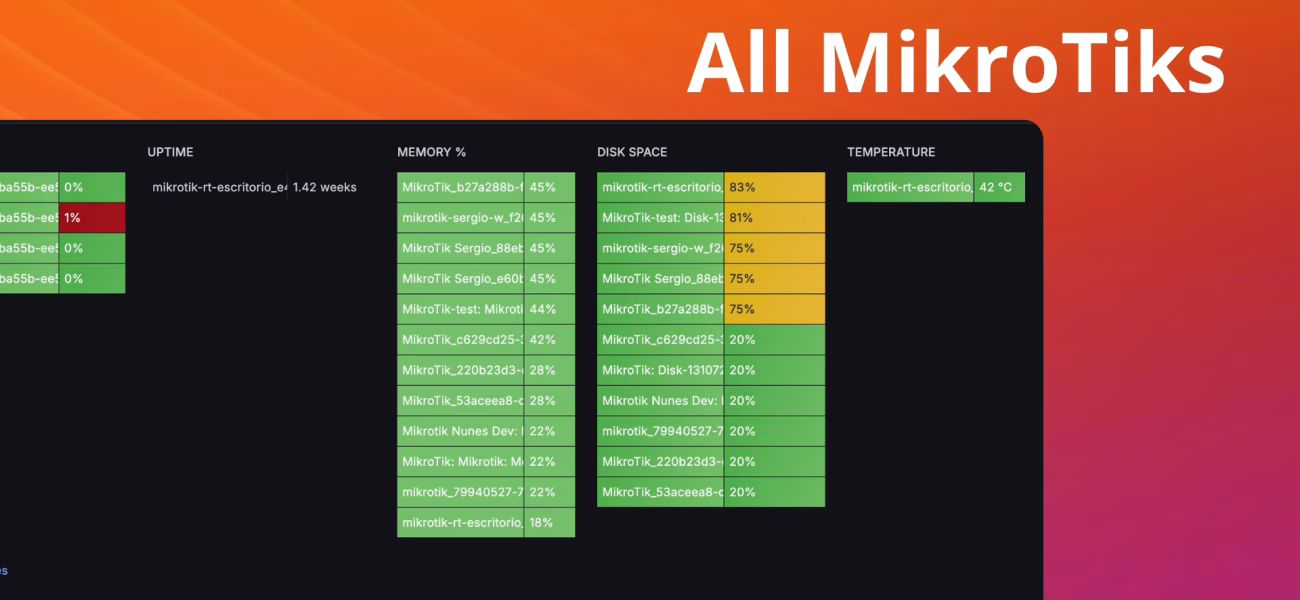
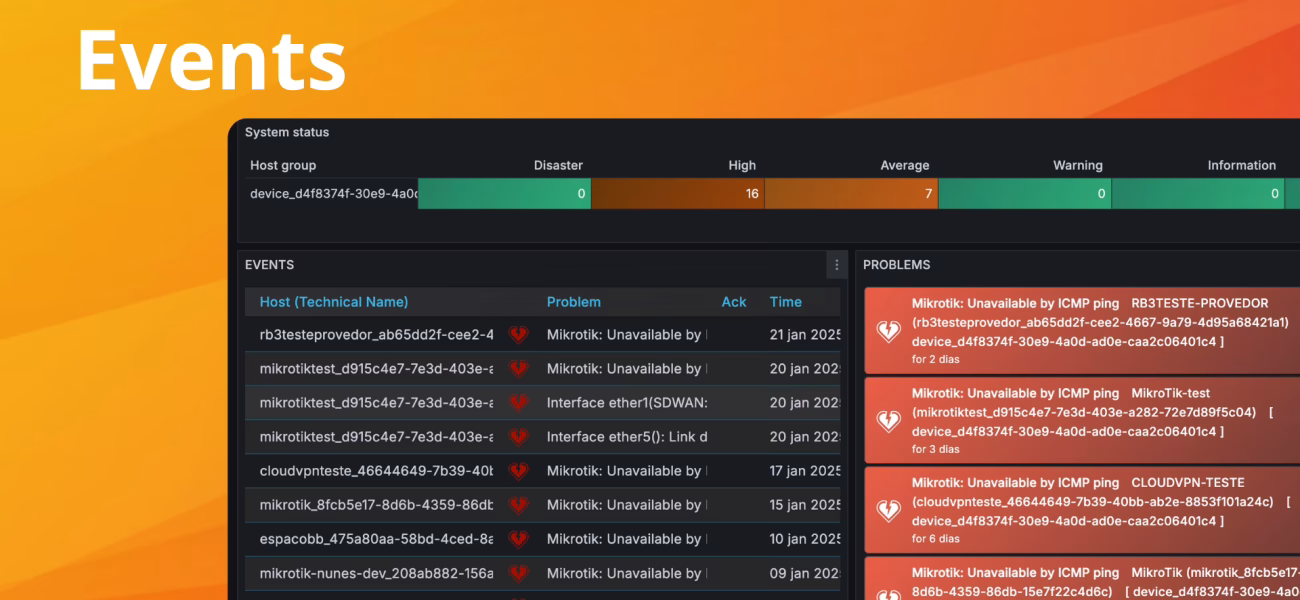
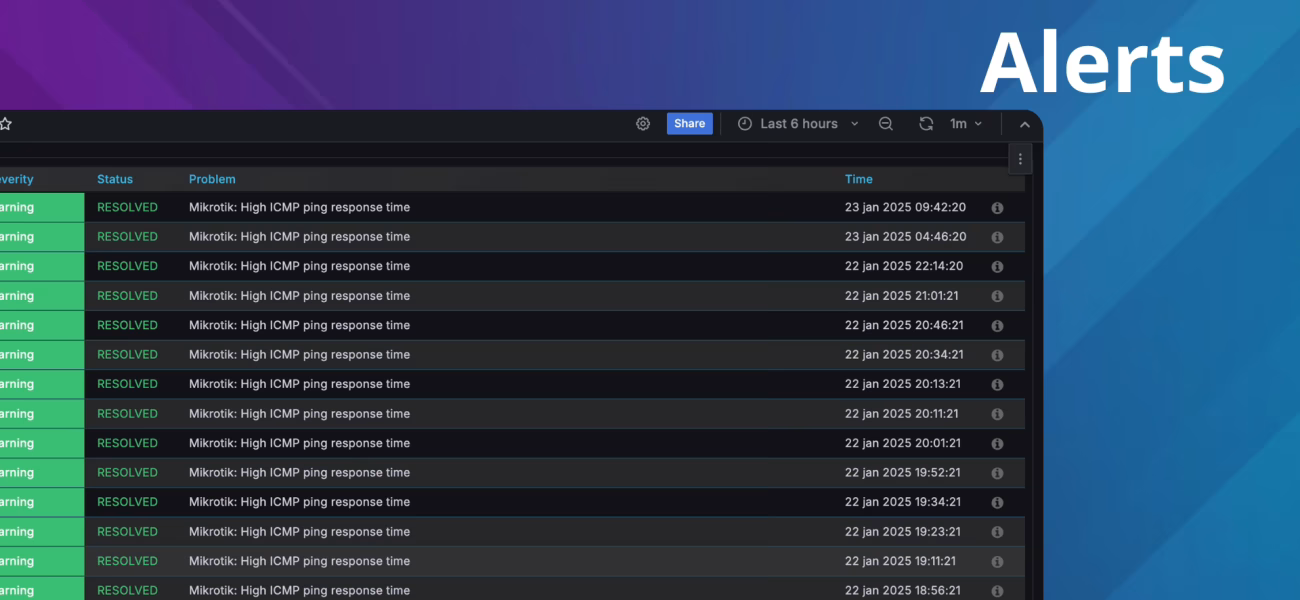
Grafana Dashboard example
With MikroTik SD-WAN integrated with Grafana, you get a complete monitoring and analytics solution. Our platform delivers an intelligent NOC and exclusive dashboards, ensuring full visibility and faster, data-driven decisions.
📡 Greater control ⚡ Faster issue resolution 📈 Real-time insights