
The monitoring screen shows an overview of the SD-WAN environment for MikroTik, with accurate information for managing and administering your networks.
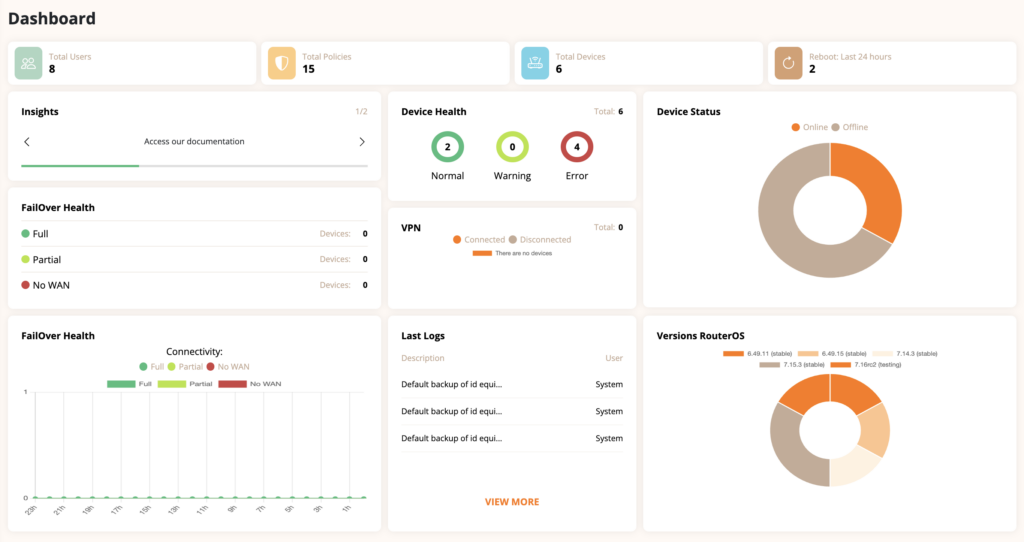
Total Users #
Displays the total number of users registered in the system. In this example, there are 8 users.
Total Policies #
Shows the number of active policies in the platform. The displayed value is 15.
Total Devices #
Displays the total number of devices managed by the platform. In this case, there are 6 devices.
Reboot: Last 24 hours #
Shows the number of device reboots in the last 24 hours. 2 reboots have been recorded.
Insights #
Provides recommendations and quick links to platform resources, such as documentation.
Device Health #
Displays the health status of devices, categorized as Normal (green), Warning (yellow), or Error (red). In this example, there are 2 normal devices and 4 with errors.
Device Status #
A pie chart showing the proportion of devices online (orange) and offline (beige).
FailOver Health #
Shows the failover integrity in three categories: Full (green), Partial (yellow), and No WAN (red). In the example, no devices are listed in any of the categories.
FailOver Health (Chart) #
A line chart displaying failover connectivity over time, indicating the number of devices in Full, Partial, or No WAN.
VPN #
Displays the VPN connection status of devices. In this example, there are no connected or disconnected devices.
Last Logs #
Shows recent log entries, including the action description and the user who executed it. In the example, all logs are for automatic backups performed by the system.
Versions RouterOS #
A pie chart showing the distribution of RouterOS versions on managed devices.


